For most websites, search engines and more specifically Google represent a critical part of their traffic breakdown. It is common place to see Google delivering anywhere from 25% or over 80% of the traffic to different sized sites in many different verticals.
Matt Cutts was recently asked about what the most common SEO mistakes where and he lead off the list with the crawlability of a website. If Google can’t crawl through a website, it prohibits Google from indexing the content and will therefore have a serious impact on the discoverability of that content within Google search.
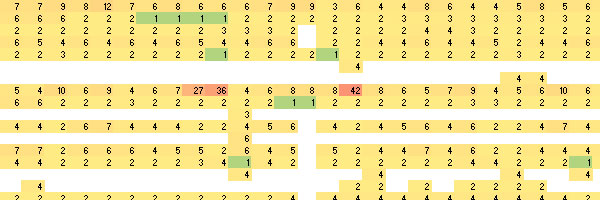
With the above in mind, it is important to understand how search engines crawl through a website. While it is possible to scan through log files manually, it isn’t very practical and it doesn’t provide an easy way to discover sections of your site that aren’t being crawled or are being crawled too heavily (spider traps) and this is where a heat map of crawl activity is useful:
In this article, we’ll briefly cover the following topics:
- Microsoft Log Parser
- Gaining Access To Your Log Files
- Organising Your Log Files
- Microsoft Log Parser Primer
- Identifying Googlebot Crawl Activity
- Microsoft Excel
- Visualisation
Microsoft Log Parser
Microsoft Log Parser is an old, little known general purpose utility to analyse a variety of log style formats, for which Microsoft describe it as:
Log parser is a powerful, versatile tool that provides universal query access to text-based data such as log files, XML files and CSV files, as well as key data sources on the Windows® operating system such as the Event Log, the Registry, the file system, and Active Directory®.
You tell Log Parser what information you need and how you want it processed. The results of your query can be custom-formatted in text based output, or they can be persisted to more specialty targets like SQL, SYSLOG, or a chart. The world is your database with Log Parser.
The latest version of Log Parser, version 2.2, was last released in back in 2005 and is available as a 1.4MB MSI from the Microsoft Download Centre. Operating system compatibility is stated as being Windows 2000, Windows XP Professional Edition & Windows Server 2003 but I run it on Windows 7, which suggests to me that it’ll probably run on Windows Vista and maybe even Windows 8.
In case you missed the really important point above that makes Microsoft Log Parser a great little utility, it allows you to run SQL like statements against your log files. A simple and familiar exercise might be to find broken links within your own website or to find 404 errors from broken inbound links.
Gaining Access To Your Log Files
Depending on the type of website you’re running and what environment you run it in, getting access to your log files can be the single biggest hurdle in this endeavor but you just need to be patient and persevere.
If you have your own web hosting, it is likely that you’ll have access to your server log files via your web hosting control panel software such as Cpanel or Plesk. That doesn’t necessarily mean that your hosting has been configured to actually log website access, as a lot of people turn it off to save a little disk space.
If your hosting doesn’t have logging enabled currently, first port of call is configuring that as it is obviously a prerequisite to visualising Googlebot crawl activity through your websites. Once configured, depending on the size of your website and how important it is in Google’s eyes – you may need to wait 4-6 weeks to get sufficient data to understand how Googlebot is accessing your website.
Corporate websites will invariably have web traffic logging enabled as it is helpful for debugging and compliance reasons. Getting access to the log files might require an email or two to your IT department or maybe a phone call to a senior system administrator. You’ll need to explain to them why you want access to the log files, as it will normally take some time for them to either organise security access for you to access that part of your corporate network or they may need to download/transfer them from your external web hosting to a convenient place for you to access them from.
Organising Your Log Files
To get the most out of this technique, you’ll want access to as many weeks or months of log files as possible. Once you download them from your web hosting provider or your IT department provides access to the log files, place them all in the same directory for log analysis by Microsoft Log Parser.
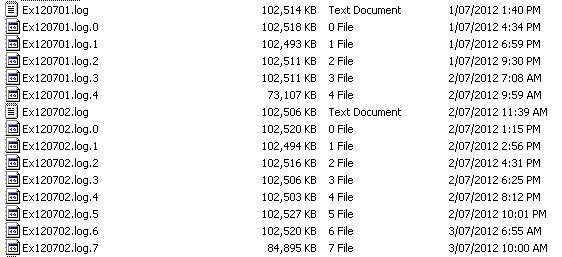
Directory Showing Daily Web Server Logs Broken Into 100MB Incremental Files
As you can see in the image above, the log files for the server I was working with generates log files with a consistent naming convention per day and produces a new incremental file for every 100MB of access logs. Your web server will probably generate a different sequence of daily, weekly or monthly log files but you should be able to put all of them into a directory without any hassle.
Microsoft Log Parser Primer
Log Parser by Microsoft is a command line utility which accepts arguments in from the command prompt to instruct it how to perform the log analysis. In the examples below, I’ve passed in three arguments to Log Parser, e, i and the query itself but you can provide as many as you need to get the desired output.
Within the query itself the columns you’d SELECT are the column headings out of the log file, so my example below I have a column heading named cs-uri-stem representing the URL without the domain information. Open one of your log files in a text editor and review the headings in the first row of the log file to find out what the column headings are to use within your SELECT statement.
Just like a SQL query in a relational database, you need to specify where to select from which under normal circumstances is a SQL database table. Log Parser maintains that same idiom, except you can select from an individual log file, where you’d provide the file name or you can select from a group of log files identified by a pattern. In the examples I’ve used below, you can see that the FROM statement has ex*, which matches the pattern in the Organising Your Log Files section above.
As you’d expect, Log Parser provides a way to restrict the set of log records to analyse with a WHERE statement and it works exactly the same way it does in a traditional SQL database. You can join multiple statements together with brackets to provide precedence along with AND or OR statements.
Conveniently Microsoft Log Parser also provides aggregate functions like COUNT, MAX, MIN, AVG and many more. This in turn suggests that Log Parse also supports other related aggregate functionality like GROUP BY and HAVING, which it does in addition to ORDER BY and a raft of other more complex functionality.
Importantly for larger log analysis, Log Parser also supports storing the output of the analysis somewhere which can be achieved by using the INTO keyword after the SELECT statement as you can see in the examples below. If you use the INTO keyword, whatever the output of the SELECT statement will be stored into the file specified, whether it is a single value or a multi-column, multi-row table of data.
Microsoft provide a Windows help document with Log Parser, which is located in the installation directory and provides a lot of help about the various options and how to combine them to get the output that you need.
Now that the super brief Log Parser primer is over and done with, time to charge forward.
Identifying Googlebot Crawl Activity
While Microsoft Log Parser is an incredible utility, it has a limitation that a normal SQL database doesn’t – it does not support joining two or more tables or queries together on a common value. That means to get the data we need to perform a Googlebot crawl analysis, we’ll need to perform two queries and merge them in Microsoft Excel using a simple VLOOKUP.
Some background context so the Log Parser queries make sense below, the website that the log files are from uses a human friendly URL structure with descriptive words in the URLs in a directory like structure which end with a forward slash. While it doesn’t happen a lot on this site, I’m lower casing the URLs to consolidate crawl activity into fewer URLs to get a better sense of Googlebot’s activity as it crawls through the site. Similarly I am deliberately ignoring query string arguments for this particular piece of analysis to consolidate crawl activity into fewer URLs. If there is a lot of crawl activity around a group of simplified URLs, it’ll show up in the visualisation and be easier to query for the specifics later.
Next up, the queries themselves – open a Command prompt by going START->RUN and entering cmd. Change directory to where you’ve stored all of your log files. Microsoft Log Parser is installed in the default location on my machine but change that accordingly if needed.
Query: Find all URLs
“c:\program files\log parser 2.2\LogParser.exe” -e:5 -i:W3C “SELECT TO_LOWERCASE(cs-uri-stem), date, count(*) INTO URLs.csv FROM ex* WHERE cs-uri-stem like ‘%/’ GROUP BY TO_LOWERCASE(cs-uri-stem), date ORDER BY TO_LOWERCASE(cs-uri-stem)”
Query: Find all URLs that Googlebot accessed
“c:\program files\log parser 2.2\LogParser.exe” -e:5 -i:W3C “SELECT TO_LOWERCASE(cs-uri-stem), date, count(*) INTO googlebot.csv FROM ex* WHERE cs-uri-stem like ‘%/’ AND cs(User-Agent) LIKE ‘%googlebot%’ GROUP BY TO_LOWERCASE(cs-uri-stem), date ORDER BY TO_LOWERCASE(cs-uri-stem)”
You could be as specific with the user agent string as you like, I’ve been very broad above. If you felt it necessary, you could filter out fake Googlebot traffic by performing a reverse DNS lookup on the IP address to verify it is a legitimate Googlebot crawler per the recommendation from Google.
Microsoft Excel
Open both the CSV files output from the queries above. Add a new Excel Worksheet named “Googlebot” to the URLs.csv file and paste into it the contents of googlebot.csv. This will allow you to merge the two queries easily into a single sheet of data that you can generate the visualisation from.
VLOOKUP
Since the queries above result in more than one line per URL for each day they were accessed, a new column needs to be added to work as a primary key for the VLOOKUP. Insert a new column at column A and title it “PK” in both worksheets. In cell A2 in both worksheets, add the following function and copy it down for all rows in both worksheets:
=CONCATENATE(B2, C2)
The CONCATENATE function will join two strings together in Excel. In our instance we want to join together the URL and the date it was accessed, so that the VLOOKUP function can access the correct Googlebot daily crawl value.
Sort both Excel worksheets by the newly created PK column A->Z. Make sure this step is carried out, as a VLOOKUP function doesn’t work as you expect if the tables of data you’re looking up data from aren’t sorted.
Add a new column named Googlebot to your URLs worksheet and in the first cell we’re going to add a VLOOKUP function to fetch the number of times a given URL was crawled by Googlebot on a given date from the Googlebot worksheet:
=IFERROR(VLOOKUP(A2,Googlebot!$A$2:$D$8281, 4), 0)
The outer IFERROR says if there is an error with the VLOOKUP function, return a 0. This is helpful since not all URLs within the URLs worksheet have been accessed by Googlebot. The inner VLOOKUP function looks up the value for A2, the URL & date value you added earlier in the first column from the rows and columns of the Googlebot worksheet minus the column headings. If you’re not familiar with the $ characters in between the Excel cell references, they cause the range to remain static when the function is copied down the worksheet.
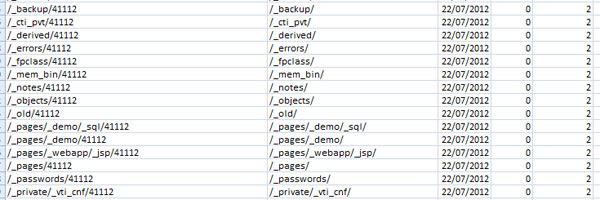
The image above shows, left to right the URL with numeric date appended, actual URL, date the URL was crawled, number of times Googlebot crawled the URL and the total number of times the URL was accessed.
PivotTable
Microsoft Excel provides a piece of functionality named PivotTable, which essentially allows you to rotate or pivot your spreadsheet of information around a different point and perform actions on the pivoted information such as aggregate functions like sum, max, min or average.
In our example, we don’t need to perform calculations on the data – that was performed by Log Parser. Instead the pivot table is going to turn the date column from the URLs worksheet that has a unique date for each day within your log files and transform them by making each unique date a new column. For example, if you were analysing 30 days of crawl information, you’ll go from one column containing all 30 dates to having 30 columns representing each date.
Within the URLs worksheet, select the columns representing the URL, date and the number of times Googlebot crawled the URLs. Next click Insert from the Excel navigation and select Pivot Table (left most icon within the ribbon navigation in recent versions of Microsoft Office). Once selected, Excel will automatically select all rows and columns that you highlighed in the worksheet and pressing Ok will create a new worksheet with the pivot table in it ready for action.
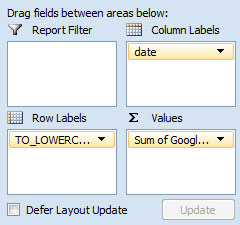
Within the PivotTable Field List in the right column, place a check in each of the three columns of information imported into the pivot table. In the bottom of the right column, drag the fields around so that the date field is in the Column Labels section, URL is within the Row Labels section and the Googlebot crawl is within the Sum Values section. Initially Excel will default to using a count aggregate function, but needs to be updated to SUM by clicking the small down arrow to the right of the item, selecting Value Field Settings and picking SUM from the list.
Visualisation
Now that the data has been prepared using the PivotTable functionality within Excel, we’re able to apply some sort of visual cue to the data to make it easier to understand what is happening. To solve that problem quickly and easily, we’re going to use Conditional Formatting that allows you to apply different visual cues to data based on the data itself.
Select the rows and columns that daily represent the daily crawl activity, don’t include the headings or the total column or it’ll skew the visualisation due to the large numbers in those columns. Once selected, click the Home primary navigation item and then Conditional Formatting, expand out Colour Scales and choose one you like. I chose the second item in the first row, as such URLs with lots of crawl activity will appear red or hot.
Tip
To increase the density of the visualisation in case you’ve chosen to visualise large date range, select the columns that represent the dates, right click Format Cells, then into the Alignment tab and set the text direction to 90 degrees or vertical.
Use the zoom functionality in the bottom right corner of Excel to zoom out if necessary and what you’re lead with is a heat map showing Googlebot crawl activity throughout the different URLs within your website over time.
Without a mechanism to visualise the crawl rate of Googlebot, it would be impossible to understand why the three URLs in the middle of the image were repeatedly crawled by Googlebot. Could this have been a surge in links off the back of a press release, maybe there was press coverage that didn’t link and that represents a fast, easily identifiable link building opportunity.
It is now dead simple to see what sections of your website aren’t getting crawled very often, what sections are getting crawled an appropriate amount and what sections could be burning up Googlebot crawl resources needlessly that could be spent crawling useful content in other sections of the website.
Go forth and plunder your web server logs!
I had some fun playing with this today, a good weekend project.
I can confirm Microsoft Log Parser Primer works on Windows 8.
I had some trouble with the VLOOKUP, eventually I solved it by forcing exact match:
=IFERROR(VLOOKUP(A2,Googlebot!$A$2:$D$999, 4, FALSE), 0)
See the extra FALSE parameter.
I also noticed we have to make sure the D$number is larger than our table size.
The resulting data did not tally with reality, I was getting very low numbers. Further investigation and I noticed the query commands were filtering out most of the URLs due to the LIKE ‘%/’ command. My URLs don’t end in slashes, I switched it to LIKE ‘%/’ and voilà, loads of lovely data.
I thought Google cached the robots.txt file on a daily basis, so why am I getting it hit at least once an hour?
Time for a break.